


Find the expected water hardness at your address
Water in the Madison area comes from an underground aquifer and contains dissolved calcium and magnesium, which makes the water “hard.” Water hardness varies by location and over time, so it is important to ensure the hardness setting on your water softener accurately reflects the incoming water. Use the water hardness map below to help determine the proper setting.
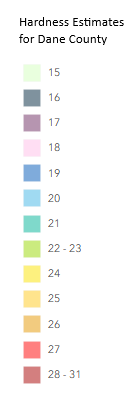
The water hardness map and chart provide an expected hardness for your address. These estimates, reported in grains, were developed with local water utilities and should be used to set softener efficiency. Water hardness is not a single static number. There are very small, natural fluctuations in local groundwater over time. These numbers come from water utilities that have used laboratory testing and historical data to determine mineral content. Color-changing test strips and titration field tests have been shown to be error-prone and produce unreliable results.
Search for an address in the District’s service area using the search bar or magnifying glass icon within the map. Click the colored area that the address occupies to see the expected hardness for that address.
Areas in gray are not served by a municipal drinking water utility tributary to the Madison Metropolitan Sewerage District. Check with a municipal authority of test water quality using multiple iterations of testing to determine hardness in these areas.
| Cottage Grove | 21 |
| Deforest | 15 |
| Fitchburg | 16 |
| Madison | Multiple; see map or Madison Water Utility website |
| Maple Bluff | Multiple; see map |
| McFarland | 21 |
| Middleton | Two zones: 22 and 20 |
| Monona | 24 |
| Morrisonville | 20 |
| Shorewood Hills | Multiple; see map |
| Verona | 20 |
|
Waunakee |
15 |
|
Windsor |
20 |
